Powerful brands are important anchor points for consumers.
Brand loyalty is established early. Successful brands manage to maintain loyalty not only during specific life phases but over their consumers’ entire lifetime.
It’s crucial that brands with long-term success are not merely known by a product or logo. Instead, they need to form convincing, reliable and emotionally attractive “images”, with which consumers can identify and which they can, perhaps, use to distinguish themselves from other people.
In any case a strong brand needs to establish a connection with the consumer that goes beyond the purely rational – such as a certain product performance, or a volatile trend or zeitgeist, so that the brand finds a place in the “heart” of the consumer.
In the eye of the consumer the image of a brand is both the rationally justifiable and the emotionally conveyed atmosphere of the overall picture generated by the brand.
In the context of brand management the first purpose of an image analysis is the identification of the image’s status quo, preferably in relation to the competition. By comparing with competitor images one’s own image is determined in order to find its position in the competitive set and its strengths and weaknesses.
Critical question in this context are:
What associations does the brand trigger – rationally and emotionally?
How can the brand core be described?
How does the brand different from the competitive set?
As a matter of course answering these questions should be an on-going process in consideration of market development and positioning of brand, its strategy and core values.
Before doing a valid quantitative image analysis it is necessary to find out the image dimensions relevant to the consumer. The following qualitative methods are usually recommended:
First: Focus groups and/ or in-depth interviews
Speaking face to face with consumers of the particular product category will raise issues about relevant product features important to the category. Respondents describe their purchase and usage habits, what they are looking when buying and what experiences they have made with the product. Needless to say respondents are also asked to mention and discuss their likes and dislikes of relevant brands.
In order to go beyond the purely rational level we use projective methods and techniques that stimulate the non-verbal level. For example, the following methods will be used:
FAMILY BUILDING
Participants receive cards with logos or packages of relevant brands and are asked to group them intuitively into “families”, i.e. groups of brands similar to each other but different to other groups. In the following discussion it’s important to explore the reasons for similarities and differences, respectively.
REPERTORY GRID
In the context of personal interviews respondents are given exactly three cards (or packages) with logos of relevant brands. The respondents are then asked to group two of those cards whose brands are more similar to each other than the third. Reasons for similarity and difference are explored. The interview then proceeds with further sets of three cards up to the point when all brands stand in combination with each other. The properties of the brands are recorded on a grid.
All properties are then checked, summarized and combined into meaningful image groups. Ideally, the consumer will be able to give image items relevant to him or her.
MIND MAP & EMOTIONAL MAP
Methods such as the MindMap allow leaving the rational level of the discussion or interview:
As part of an interview, respondents create a visual map of their subjective image perception by connecting text items describing the brand via drag & drop using computer or tablet. This intuitive technique allows connecting items directly to the brand and among each thereby enabling the respondents to map a brand as the hub of interrelated image items. In addition to pre-defined items respondents are encouraged to add their own items and associations. During the analysis the network formed by the items of the whole sample is aggregated to form an overall MindMap of brand perception.
An even deeper look at the emotional world is achieved through the Emotion-Map:
Here we use validated pictures that can convey spontaneous emotions and associations even better than words. With the help of these images subconscious perceptions can be uncovered, that cannot be covered in a purely explicit interview.
As in the MindMap scenario, respondents generate a personal image of a brand. This time, however, they choose independently and intuitively from a selection of validated pictures and images that can also be enriched by existing communication elements of a brand. Once again, this easy-to-use technology works via drag & drop on laptop or tablet PC.
In a further step the strength and direction (positive/ negative) of each picture can be marked. Particularly exciting for a subsequent quantitative image analysis is the third step of the Emotion-Map:
Respondents are asked to freely narrate their associations to the pictures they selected and what they mean to them. This “talking in pictures” makes it possible in a qualitative analysis to find new and fascinating descriptions for the characteristics that were attributed indirectly to the brand
Naturally, both methods – Mind-Map and Emotion-Map – can be integrated seamlessly into quantitative online and CAPI studies.
Finally: Quantitative Image Evaluation and Analysis
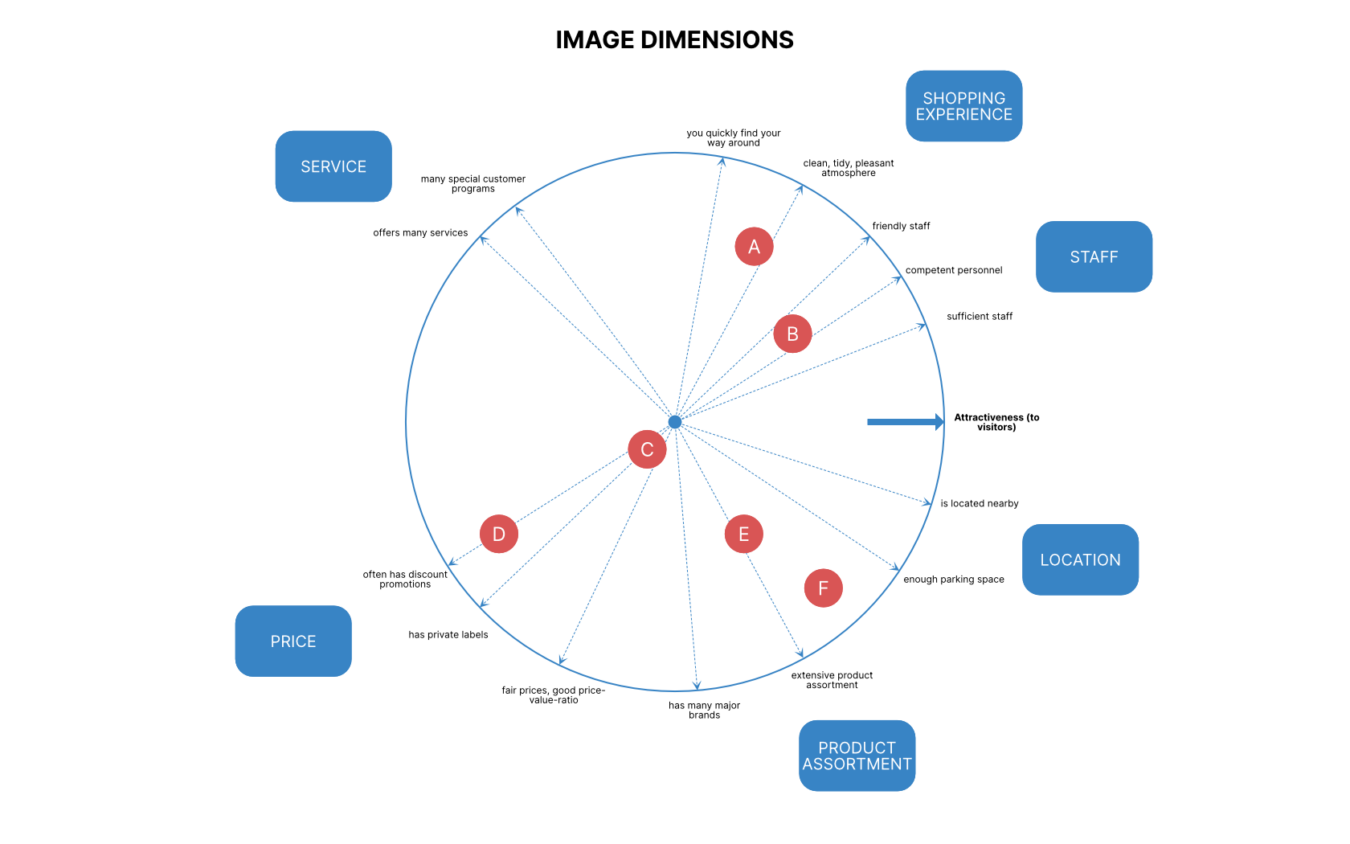
After questions about brand awareness and brand usage consumers of the respective product group are asked to evaluate important brand descriptions. During this central part of the image analysis respondents assign a scaled value to each descriptive item in order to signify to what degree it fits or does not fit to a particular brand. This item battery was evaluated beforehand during a qualitative step. It is written in marketing style that is also consumer friendly. Brands and their image dimensions are then mapped relative to each other by using multi-dimensional scaling.
On the first view proximities/ similarities and distances/ island positions of brands (in the graphic: markets) and image attributes are discernible. Furthermore, higher-ranking image dimensions that determine brands, their positioning – also in relation to purchase attractiveness (in the graphic: attractiveness to visitors) are readable.
This classic approach can be complemented by the Mind- or Emotion-Map described above.
Given sufficient sample size these image mappings can also be shown for pre-defined sub-groups of age and gender or user and non-user.
For a target group oriented brand management it is advisable to combine an image analysis with segmentation or a cluster analysis, respectively. These methods allow a distinction between brand images of specific consumer types that differ in their needs and attitudes.
Get in touch with us if you want to get to understand your brand and target groups even better – rationally or emotionally!
In order to continuously improve the user experience of this site, we use cookies.Yes, agreedNoRead policy